Iris
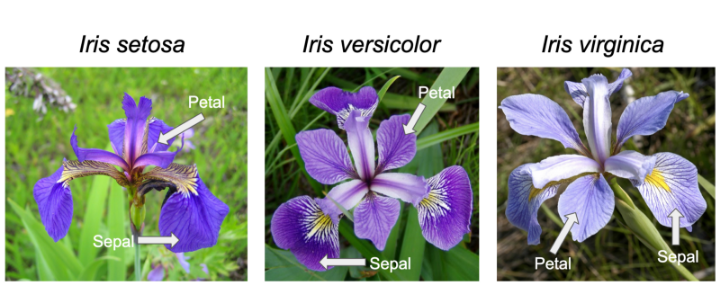
Iris is one of the databases built into R (ie it can be accessed without loading), and used by Learn R through examples among others to teach the basics.
Other built-in datasets include:
- mtcars: Motor Trend Car Road Tests
- ToothGrowth
- PlantGrowth
- USArrests
The data() function provides the full list.
Scatterplot
iris$speciesID <- as.numeric(iris$Species) + 1
iris$shape <- ifelse(iris$Sepal.Length < 5.15, 17, 20)
svg("petal-width-length1.svg", width = 11, pointsize = 12, family = "sans")
plot(Petal.Length ~ Petal.Width, data = iris, col = speciesID, pch = shape)
legend("topleft", levels(iris$Species), fill = 2:4)
dev.off()

Density Plot
library(ggplot2)
svg("iris_petal_length_density.svg", width = 11, pointsize = 12, family = "sans")
ggplot(data = iris) +
  aes(x = Petal.Length, fill = Species) +
  geom_density(alpha = 0.3)
dev.off()

library(ggplot2)
svg("iris_petal_width_density.svg", width = 11, pointsize = 12, family = "sans")
ggplot(data = iris) +
  aes(x = Petal.Width, fill = Species) +
  geom_density(alpha = 0.3)
dev.off()

Decision tree
The external tree package, which needs to be installed with install.packages("tree"), can be used like so:
library(tree)
iris_tree <- tree(formula = Species ~ ., data = iris)
svg("iris_tree.svg", width = 11, pointsize = 12, family = "sans")
plot(iris_tree)
text(iris_tree, pretty = 0)
dev.off()

This produces the rules:
- if Petal.Length < 2.45cm, Species = setosa
- if Petal.Width >= 1.75cm, Species = virginica
- if Petal.Length >= 2.45cm and Petal.Length < 4.95cm and Petal.Width < 1.75cm and Sepal.Length >= 5.15cm, Species = verscicolor
- if Petal.Length >= 2.45cm and Petal.Width < 1.75cm and Sepal.Length < 5.15cm, Species = virginica
The snag is Petal.Length > 4.95 and Petal.Width < 1.75
iris$speciesID <- as.numeric(iris$Species) + 1
iris$shape <- ifelse(iris$Sepal.Length < 5.15, 17, 20)
svg("petal-width-length.svg", width = 11, pointsize = 12, family = "sans")
plot(Petal.Length ~ Petal.Width, data = iris, col = speciesID, pch = shape)
legend("topleft", levels(iris$Species), fill = 2:4)
abline(h = 2.45, col = 2)
abline(h = 4.95, col = 4)
abline(v = 1.75, col = 3)
dev.off()

> str(iris)
'data.frame':	150 obs. of  5 variables:
 $ Sepal.Length: num  5.1 4.9 4.7 4.6 5 5.4 4.6 5 4.4 4.9 ...
 $ Sepal.Width : num  3.5 3 3.2 3.1 3.6 3.9 3.4 3.4 2.9 3.1 ...
 $ Petal.Length: num  1.4 1.4 1.3 1.5 1.4 1.7 1.4 1.5 1.4 1.5 ...
 $ Petal.Width : num  0.2 0.2 0.2 0.2 0.2 0.4 0.3 0.2 0.2 0.1 ...
 $ Species     : Factor w/ 3 levels "setosa","versicolor",..: 1 1 1 1 1 1 1 1 1 1 ...
svg("pie.svg", width = 11, pointsize = 12, family = "sans")
pie(table(iris$Species))
dev.off()

model = lm(formula = Sepal.Length ~ Sepal.Width, data = iris)
iris$speciesID <- as.numeric(iris$Species) + 1
svg("sepal-width-length.svg", width = 11, pointsize = 12, family = "sans")
plot(Sepal.Length ~ Sepal.Width, data = iris, col = speciesID, pch = 20)
legend("topleft", levels(iris$Species), fill = 2:4)
abline(model)
dev.off()

svg("sepal-length.svg", width = 11, pointsize = 12, family = "sans")
boxplot(formula = Sepal.Length ~ Species, data = iris)
dev.off()

svg("sepal-width.svg", width = 11, pointsize = 12, family = "sans")
boxplot(formula = Sepal.Width ~ Species, data = iris)
dev.off()

svg("petal-length.svg", width = 11, pointsize = 12, family = "sans")
boxplot(formula = Petal.Length ~ Species, data = iris)
dev.off()

svg("petal-width.svg", width = 11, pointsize = 12, family = "sans")
boxplot(formula = Petal.Width ~ Species, data = iris)
dev.off()
